U.S. Utilities Combine EPAct Tax Savings with the Rosenfeld Curve
In March of 2010 dozens of leading scientists signed a paper proposing to name a new unit of measurement called "the Rosenfeld." A Rosenfeld denotes the energy and money saved by not building a five hundred megawatt coal fired plant. Many leading utilities are using the Rosenfeld concept to offer their utility ratepayers a much lower cost alternative to building or retrofitting expensive power plants. The utility provided Rosenfeld alternative includes utility provided cash rebates and outreach regarding section 179D EPAct tax savings.
Code Section 179D EPAct Opportunities
Pursuant to Energy Policy Act (EPAct)1 Code Sec. 179D, as enacted by EPAct, commercial property owners or primary designers in government projects making qualifying energy-reducing investments in their new or existing locations can obtain immediate tax deductions of up to $1.80 per square foot
If the building project does not qualify for the maximum $1.80-per-square-foot immediate tax deduction, there are tax deductions of up to $0.60 per square foot for each of the three major building subsystems: lighting, HVAC (heating, ventilating, and air conditioning) and the building envelope. The building envelope is every item on the building’s exterior perimeter that touches the outside world including roof, walls, insulation, doors, windows and foundation.
The Rosenfeld Thesis
Art Rosenfeld2 was a Princeton University physics professor who analyzed America's energy use practices. Until Professor Rosenfeld challenged conventional wisdom, U.S. utilities routinely projected regular increases in U.S. electrical demand. For 25 years utility industry executives argued that energy demand and GNP growth worked in tandem. With this belief set, the consensus logic dictated the continuing need to build more power plants. However a group of leading physicists led by Rosenfeld didn't accept the conventional wisdom. Rosenfeld proceeded to put together an influential Princeton energy study which concluded that systematic steps to improve energy efficiency could materially reduce demand.
The California Rosenfeld Effect
Rosenfeld's findings evolved first into new standards for more efficient refrigerators and freezers which were first enacted by the state of California. The California standards were eventually adopted at the Federal level. The appliance standards evolved into a more rigorous California building energy code which in large part provides the methodology and mechanics for documenting Section 179D. From 1960 to 1974 California follows the national increases in electrical consumption patterns. However, from 1974 until 2008 while the rest of the country's electrical consumption continually rises California's consumption remarkably levels out. Energy experts call this demand leveling effect the "Rosenfeld curve" or "Rosenfeld effect."
Chart 13
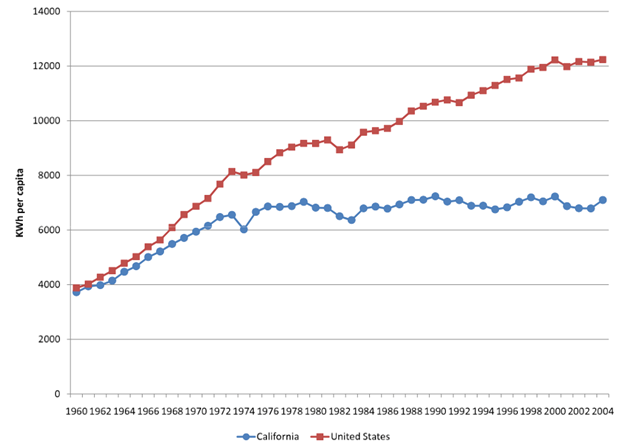
As illustrated above, by 2004, the annual per capita KWh usage in California was less than the national average by approximately 5000 KWh. The reasons for this leveling off in consumption are many and varied but technology innovations and important policy changes can be credited as the prime driving forces behind the change.
About half of these savings are the result of strengthened performance standards for buildings and appliances made possible by advances and efficiency improvements in HVAC and lighting technology. The other half can be attributed to utility company programs that promote adoption of energy efficient technologies. These programs were implemented after years of work between energy conservation advocates such as Dr. Rosenfeld and utility companies that needed to re-engineer their methods of recovering costs so that revenue could still grow as consumption leveled off.4
The most important conclusion is that if California, the nation's largest market state, can achieve this result, a large nationwide energy reduction is clearly achievable.
Current U.S. Utility Developments
Throughout the United States many constituents are successfully opposing new power plants and in particular new coal fired and nuclear plants. New power plant opponents often cite the Rosenfeld curve. Recognizing the new reality, utilities are increasingly acting on the Rosenfeld effect by encouraging consumers by offering cash rebates to retrofit and upgrade to energy efficient lighting, HVAC and better building envelope products. Knowledgeable utilities are combining the cash rebates with extensive outreach and informing rate payers about EPAct tax incentives.
Some examples of recent and ongoing utility industry EPAct tax education outreach are:
- The multi-state Vermont Energy Investment Corporation (VEIC) has recently trained it's internal engineering professional staff advisers in the utilization of EPAct tax incentives.
- First Energy, a leading multi-state utility, has just provided 15 combined EPAct and utility presentations to it's rate payers in as many towns and cities in three states including Western Pennsylvania, Maryland and West Virginia.
- National Grid has provided combined utility and rebate presentations to ratepayers in Massachusetts and Connecticut.
- The Long Island Power Authority (LIPA) regularly provides combined rebate and EPAct presentations to it's rate base. Long island has specifically announced that it wants to use an aggressive upgrade program to eliminate the need for a previously planned power plant.
Professor Rosenfeld's energy reduction theories can eliminate major utility industry power plant related capital expenditures. Smart utilities can achieve these goals by offering less costly cash rebates combined with informing their customers of U.S. federal tax policies specifically created to achieve these goals.
References:
(1) Energy Policy Act of 2005 (P.L. 109-58) ("EPAct").
(2) California Energy Commission: http://www.energy.ca.gov/commissioners/rosenfeld.html
(3) Chart 1 - Harvey Mudd College:
http://www.physics.hmc.edu/~saeta/courses/p80/wiki/index.php?n=Main.Berkeley2011Day2
(4) Arthur H. Rosenfeld with Deborah Poskanzer, A Graph Is Worth a Thousand Gigawatt-Hours - Published for the journal Innovations Fall 2009 and available online at http://www.energy.ca.gov/commissioners/rosenfeld_docs/INNOVATIONS_Fall_2009_Rosenfeld-Poskanzer.pdf